
Cosmos, The Infographic Book of Space
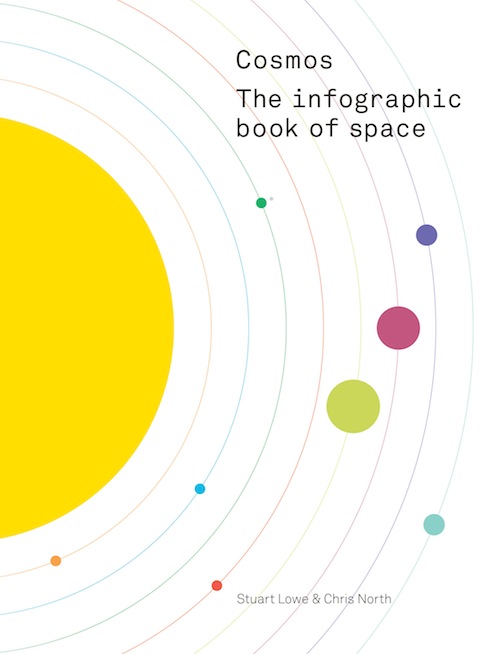 by Stuart Lowe & Chris North
Cosmos is made up of cleverly done, interesting, and information-rich graphics that range, to quote the authors, “from human exploration of the Earth and Moon, to the way galaxies are scattered throughout the cosmos over scales of billions of light years; from the building of telescopes to observe the heavens, to humanity’s attempts to contact alien civilizations. What ever your knowledge of space and astronomy, there’s bound to be something to interest you.”
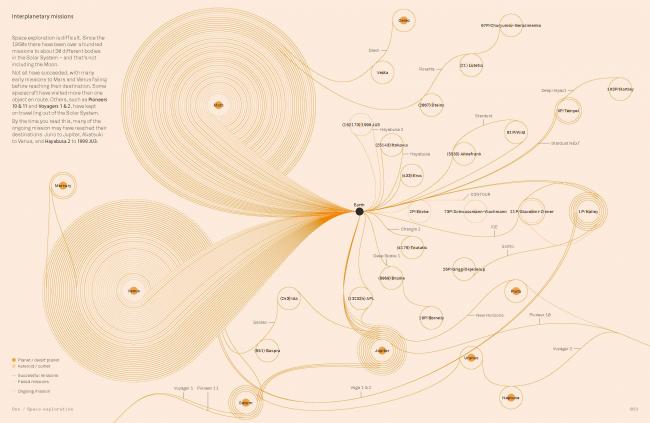
The authors are not exaggerating. I found Cosmos hard to put down and enjoyed examining the 105+ graphic illustrations. Each of the 15 x 20″ double-page graphics successfully displays a size and/or relationship story in visual terms. A paragraph or two at the beginning of each graphic explains what you are looking at, then you are on your own to figure out the rest for yourself. Statistical data, when relevant, is presented visually, so a brain wired for math is not required to understand what’s happening.
Cosmos was written by two English astronomers involved in radio telescopes, far-infrared light observation, and astrophysics. They are also both promoters of space and astronomy awareness in general, and host podcasts and BBC shows. In short, they know what they’re talking about, and know how to get that knowledge across to the general public.
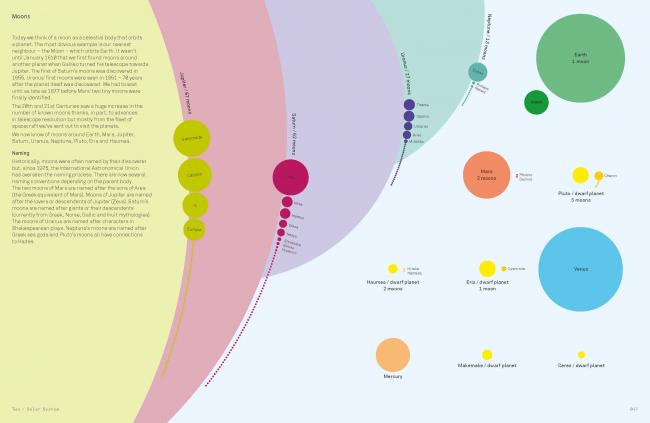
The infographic concerning the Sun’s size relative to its larger brothers and sisters, and to our Earth, I found particularly enlightening. I was already aware that giant stars could be up to 1,700 times larger than our sun, but I couldn’t visualize how large that was until this book slapped me briskly into awareness with its solar comparison page. Other graphics concern themselves with atmospheric windows (what and where they are), the cosmic web, space stations (there have been five so far), where the world’s 23 orbital launch sites are located, how many rockets they launch, and in what directions. Over a hundred other topics are also quickly and efficiently explained through the use of graphic design.
Another infographic I enjoyed showed all the world’s rockets capable of putting a payload into earth orbit, their relative size and shape, how much money they cost to launch, and their success rate. The Chinese Long March 3B may only cost 30 million dollars to launch, but it only works 75% of the time. By comparison, for the same 30 million the Delta II works 99% of the time. Sounds reliable until you think, “Even with a 99% success rate, how many times can I ride a rocket into space and stay alive?” The answer is Not very many times. Obviously, the odds of surviving a space launch is a statistical weak link that needs improvement if the space tourism industry is ever going to get off the ground. Once in orbit, however, space travel is probably safer on a per-passenger mile basis than any other form of transport. Getting safely out of the earth’s gravity and up into low earth orbit is currently the risky bit.
This excellent book opens with a Contents page, followed by an Introduction, nine chapters, then Sources, Notes, and Acknowledgements at the end. No Index, which is unfortunate. The chapters start with Space Exploration, then progress to the Solar System, Telescopes, the Sun, Stars, Galaxies, Cosmology, Other Worlds, and finally Miscellaneous. The Miscellaneous chapter covers topics concerning relativistic effects, water worlds, comparative density for everything from interstellar clouds to black holes, to how long a day is, and other oddities. Unbeknownst to me, the length of a day fluctuates constantly, with the longest on record having occurred on April 12, 1972, and the shortest July 5, 2005. What can cause this daily fluctuation is also quickly explained in the graphic.
As I write this, I’m pondering a beautiful graphic displaying the overall magnetic polarization of our galaxy. The reader is informed that “The Milky Way has a magnetic field generated by the motion of charged particles.” The resulting display looks like a polished wood burl inlay. “The patterns highlight some of the nearby regions where stars and dust are forming, creating distortions and turbulence in the field.” This massive magnetic field connects everything with everything else throughout the galaxy, and beyond. Warning: philosophical thoughts about the connectedness of all levels of life and science creep into your mind if this page is pondered too long!
The infographics were created by the English design company Founded and Mark McCormick, under guidance from the authors. We often enough bemoan slipshod proofreading but here all is so well that it deserves to be called out (Lesley Malkin, whoever you are, hip-hip!) Moreover, everybody involved in the production of this book deserves a tip of the head for a job well done. The final product is solid and worthwhile. Cosmos was designed to satisfy an adult mind but is child-friendly for kids who are not afraid to squint their eyes and think.
The book is in contention for the “V&A Illustration Awards 2016” given by the Victoria and Albert Museum, the world’s leading museum of art and design.
Copyright 2016, Bill Ingalls (SpeedReaders.info).
 RSS Feed - Comments


 Phone / Mail / Email
 RSS Feed
 Facebook
 Twitter
The “Infograohic Book of Space” beats it all! Never saw anything like it. Genius in its simplicity. Original as never seen before. Avant-garde and futuristic. Modern and playful. Very instructive. Mind blowing. Amazing! I love it! ❤
Hi Stuart & Chris,
I recently discovered your book and wanted to say how much I admire it, especially the clarity and elegance of the diagrams. As a practicing architect, I find them not only visually compelling but incredibly useful for communicating complex ideas.
I’m currently developing my website, http://www.lisadew.com, which I hope will evolve into a valuable resource for architecture students and the broader public, particularly as I transition toward a focus on architectural environmentalism and public speaking.
Would you be open to me sharing a few of your diagrams on my website or blog with full attribution and a link to your webpage, of course? I’d be honoured to promote your work with proper credit.
Also, I was curious, have you ever considered creating a book focused on global environmental issues? Something visual, like your existing work, but exploring topics such as CO₂ levels, Antarctic shrinkage, and climate change impacts? I believe your style could make these topics both accessible and powerful.
Warm regards,
Lisa Dew
Architect | Environmental Design Advocate
http://www.lisadew.com